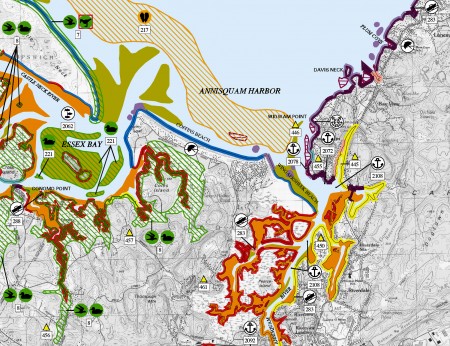
The Environmental Sensitivity Index (ESI), developed by RPI’s senior scientists in 1976, has become an integral component of oil-spill contingency planning and response and coastal resource management in the USA and other countries worldwide. The first ESI maps were prepared days in advance of the arrival of the oil slicks from the IXTOC 1 well blowout in the Gulf of Mexico. Since that time, RPI has prepared ESI atlases and databases for most of the U.S. shoreline, including Alaska and the Great Lakes. ESI atlas and database archives include the U.S. territories and many other countries worldwide. Nearly all of the maps of the lower 48 states have been compiled at a scale of 1:24,000, using U.S. Geological Survey (USGS) 7.5-minute quadrangles as the base map. There are a few exceptions where USGS maps were available at different scales or too outdated to be of use. For work in Alaska, 15-minute USGS topographic quadrangles at a scale of 1:63,360 have been used as base maps. View list of atlases »
Until 1989, ESI atlases were prepared by hand using traditional cartographic methods. Since then, RPI has generated all atlases using Geographic Information System (GIS) techniques. We are consistently upgrading the resource content and mapping capabilities to keep up with rapidly changing technologies and natural resource data collection methods.

The ESI digital databases are suitable for use across wide range of natural resource management applications. ESI datasets are comprised of:
Shoreline Classification
Ranked according to a scale relating to sensitivity, natural persistence of oil, and ease of cleanup. The sensitivity ranking is controlled by the following factors:
- Relative exposure to wave and tidal energy;
- Shoreline slope;
- Substrate type (grain size, mobility, penetration, and trafficability); and
- Biological productivity and sensitivity.
Biological Resources
Including oil-sensitive animals and rare plants; and habitats, which are used by oil-sensitive species or are themselves sensitive to oil spills, such as submersed aquatic vegetation and coral reefs. Biological resource information collected and used in ESI maps can also be used for coastal resource management. The type of data collected for the biological resources are:
- Large numbers of individuals are concentrated in a relatively small area;
- Marine or aquatic species present during special life stages or activities, such as nesting, birthing, resting, or molting;
- Early life stages or important reproductive activities occur in somewhat restricted areas;
- Restricted areas important to specific life stages or migration patterns;
- Specific areas are known to be vital sources for seed or propagation;
- The species are threatened, endangered, or rare; or
- A significant percentage of threatened/endangered species are likely to exist.
Human-Use Resources
Specific areas that have added sensitivity and value because of their use, such as:
- High-use recreational and shoreline access locations (i.e. beaches, parks, boat ramps, etc.);
- Management areas (i.e. refuges, preserves, sanctuaries, etc.);
- Resource extraction locations (i.e. water intakes, aquaculture/lease sites, etc.); and
- Archaeological, Historical, and Cultural resource sites.
