The RPI ESI Toolbar Add-In allows Environmental Sensitivity Index (ESI) users to create an on-the-fly map product that uses the same standardized NOAA ESI symbology as traditional ESI hardcopy maps. The Add-In utilizes custom code and built in labeling functionality of ArcMap to allow the user to zoom to any area or scale of an ESI dataset, turn on or off data layers or reselect data, add their own data if desired, and export a PDF map that has been dynamically symbolized, at any stage of this process.
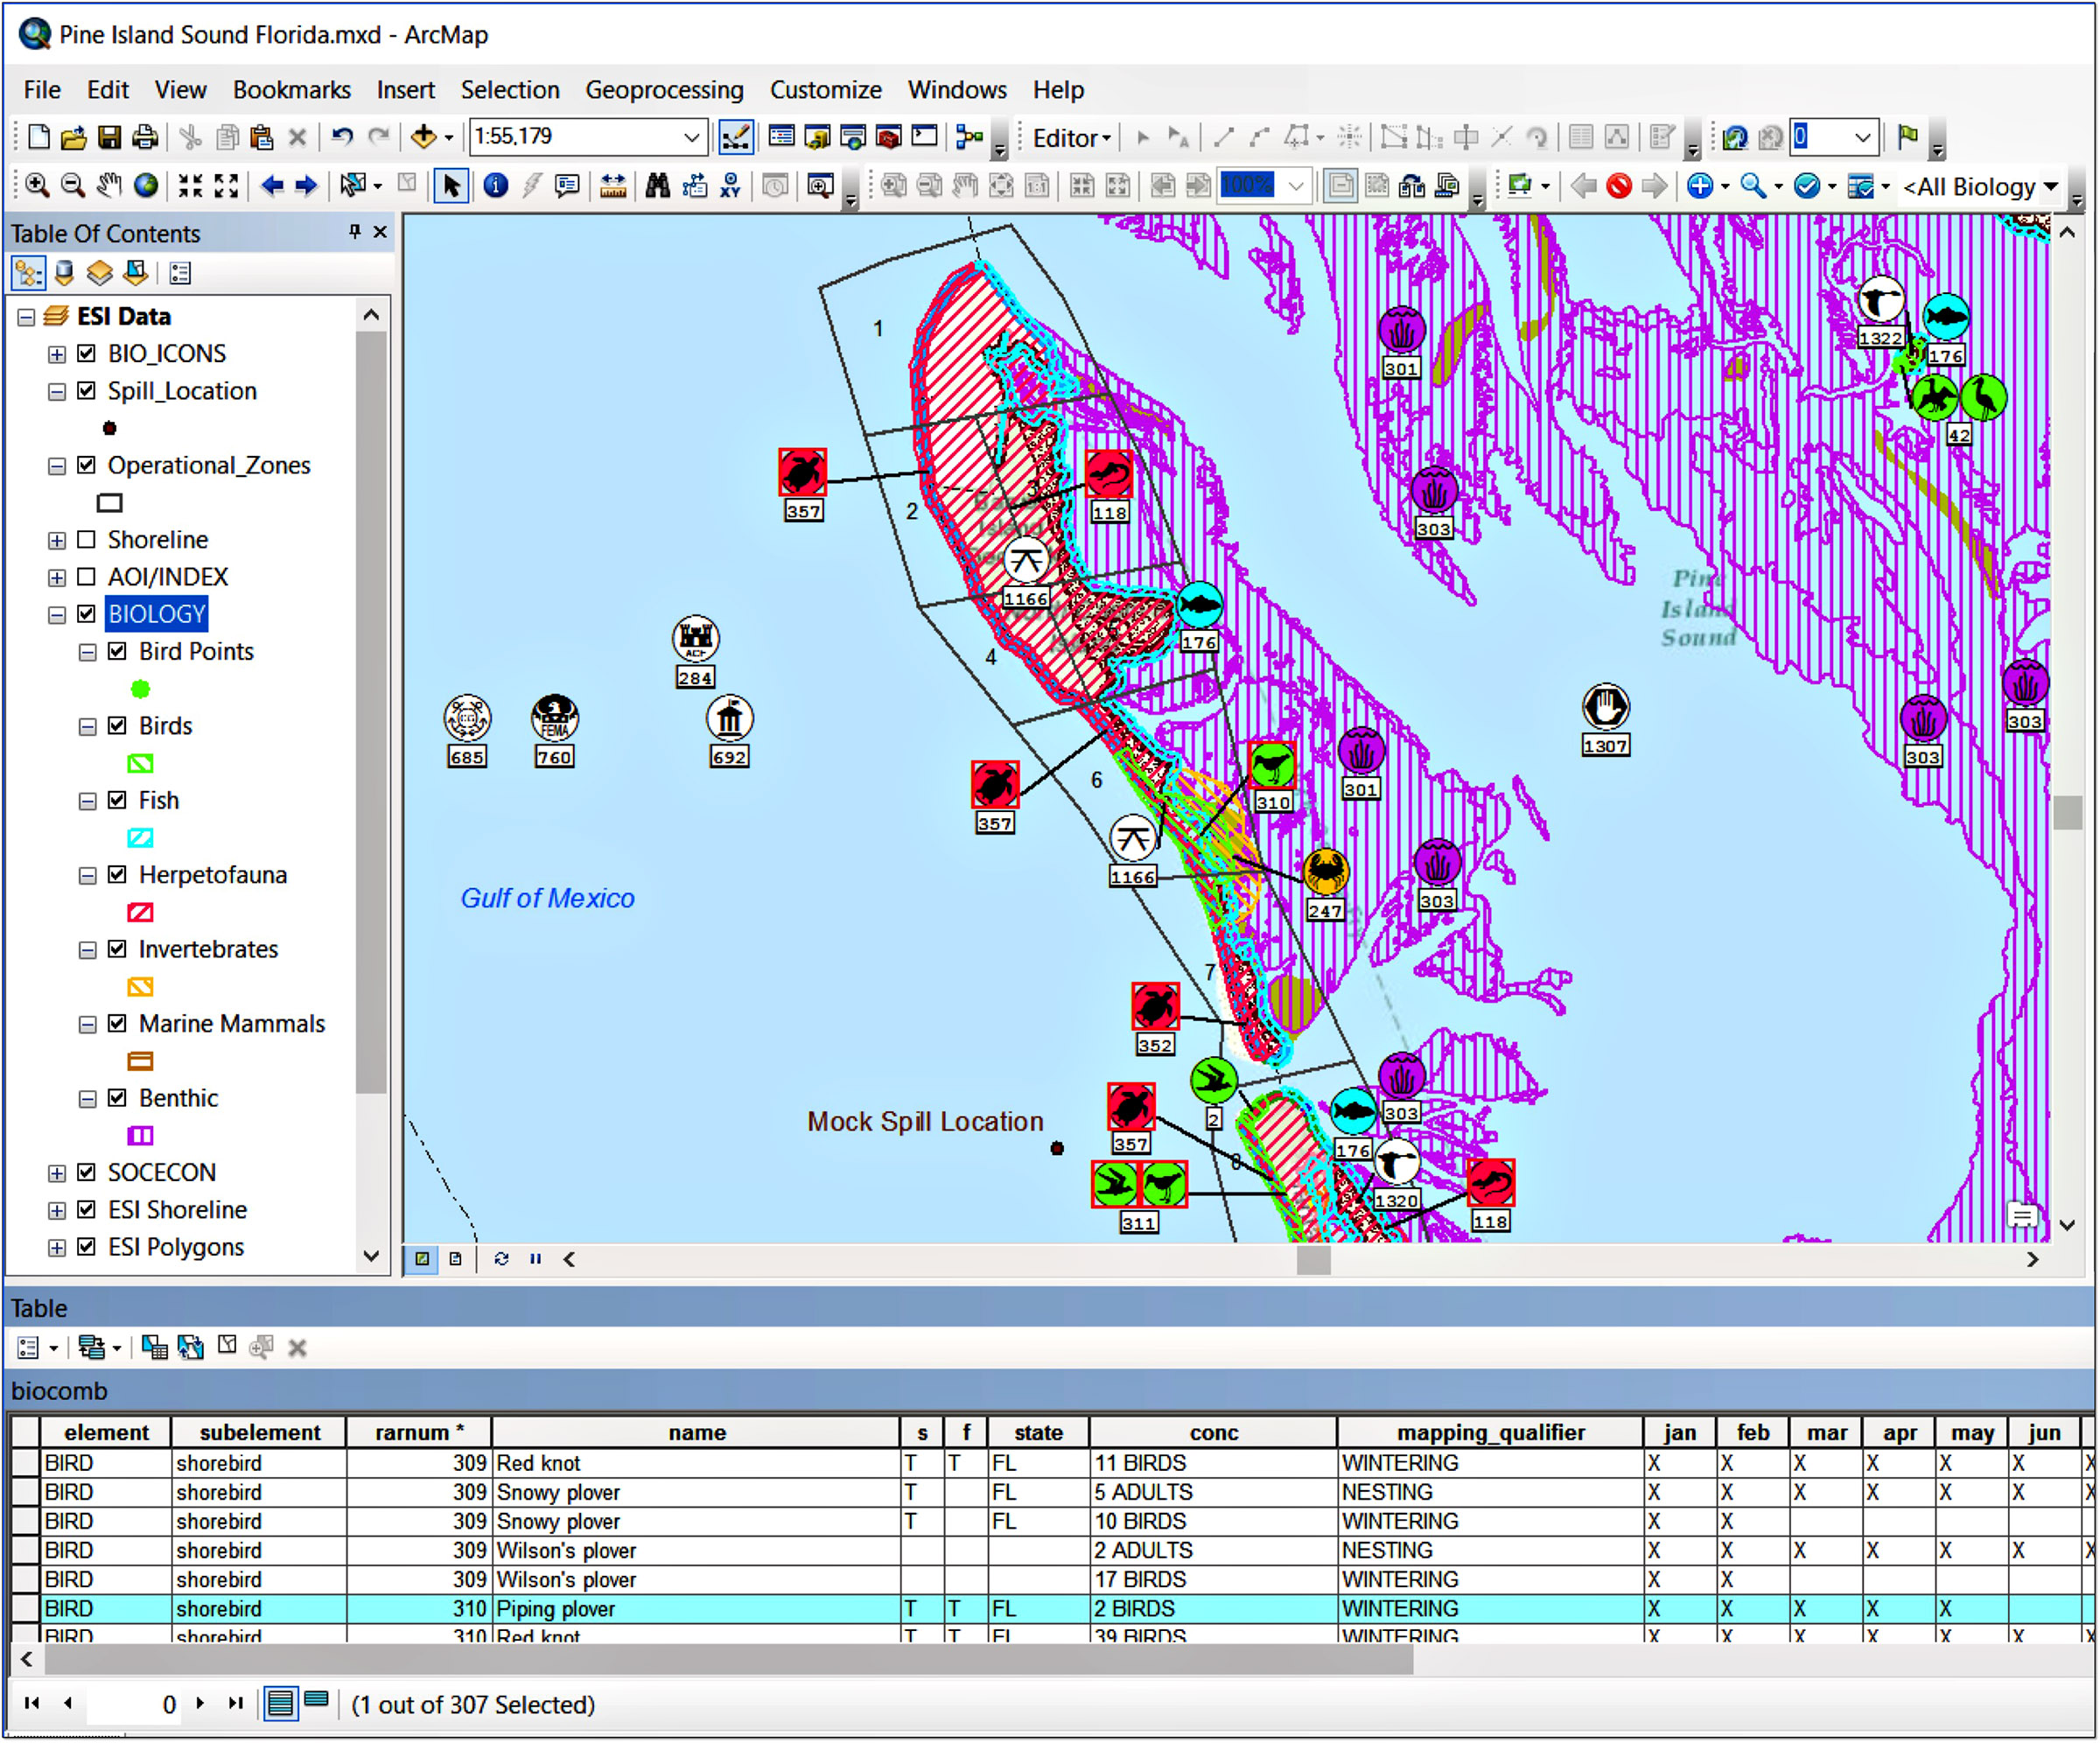
FIGURE 1: A screen shot from ArcMap displaying selected biology and human-use layers.
The RPI ESI Toolbar Add-In is designed to allow responders to quickly:
- Load ESI geodatabases and automatically apply standard ESI symbology
- Zoom to an area of interest to create a map (ESI Icons will dynamically move with the AOI)
- Query for what data should appear on the map using custom tools that relate ESI layers and tables
- Add user data to the map (e.g. spill location, ops zones, NOAA GNOME trajectory data, additional biology layers)
- Quickly create a map Layout View based on a user set page size (e.g. 8.5×11 vs. 11×17)
- Export the map to a georeferenced PDF that includes ESI Icons and Resources at Risk (RAR) numbers, the tabular data for the layers displayed on the map, and map surround information (e.g. date created, scale bar, north arrow, etc…)
- The layered and georeferenced PDF allows the user to turn on and off layers of interest to create thematic maps (e.g. show only the birds, or show only the ESI shoreline), measure distance, and show lat/long coordinates
- Additionally, Advanced Cartographic tools can be used for:
- Fine tuning the placement of ESI Icons and leader lines
- Creating Present Throughout Boxes (PTO) which remove selected spatial data from the map and describe it in the map surround (e.g. a Bird RAR described as “Present in Marshes” rather than drawn on the map)
- Converting data to Leaflet styled web maps which can be uploaded and shared online (in Beta)
The ESI Toolbar is designed for use with ESI Geodatabase products, ArcGIS version 10.4 and higher, and an ArcEditor or ArcInfo license. The tool can be used with an ArcView license as well as ESI data in Shapefile or Arc Coverage formats, but not all functionality will be available.
Contact RPI for further information on acquiring and working with the RPI ESI Toolbar and for information on valued added enhancements for map creation and data query when using the downloadable NOAA ESI geodatabases.